Astronomers create the largest 3D map of the early universe revealing hidden galaxies
- Date:
- March 9, 2026
- Source:
- University of Texas at Austin
- Summary:
- Astronomers have created the largest and most detailed 3D map yet of a glowing signal from the early universe, revealing hidden galaxies and gas from 9-11 billion years ago. By analyzing faint “Lyman-alpha” light emitted by energized hydrogen, scientists used an advanced technique called line intensity mapping to capture not just the brightest galaxies but also the vast cosmic structures surrounding them.
- Share:
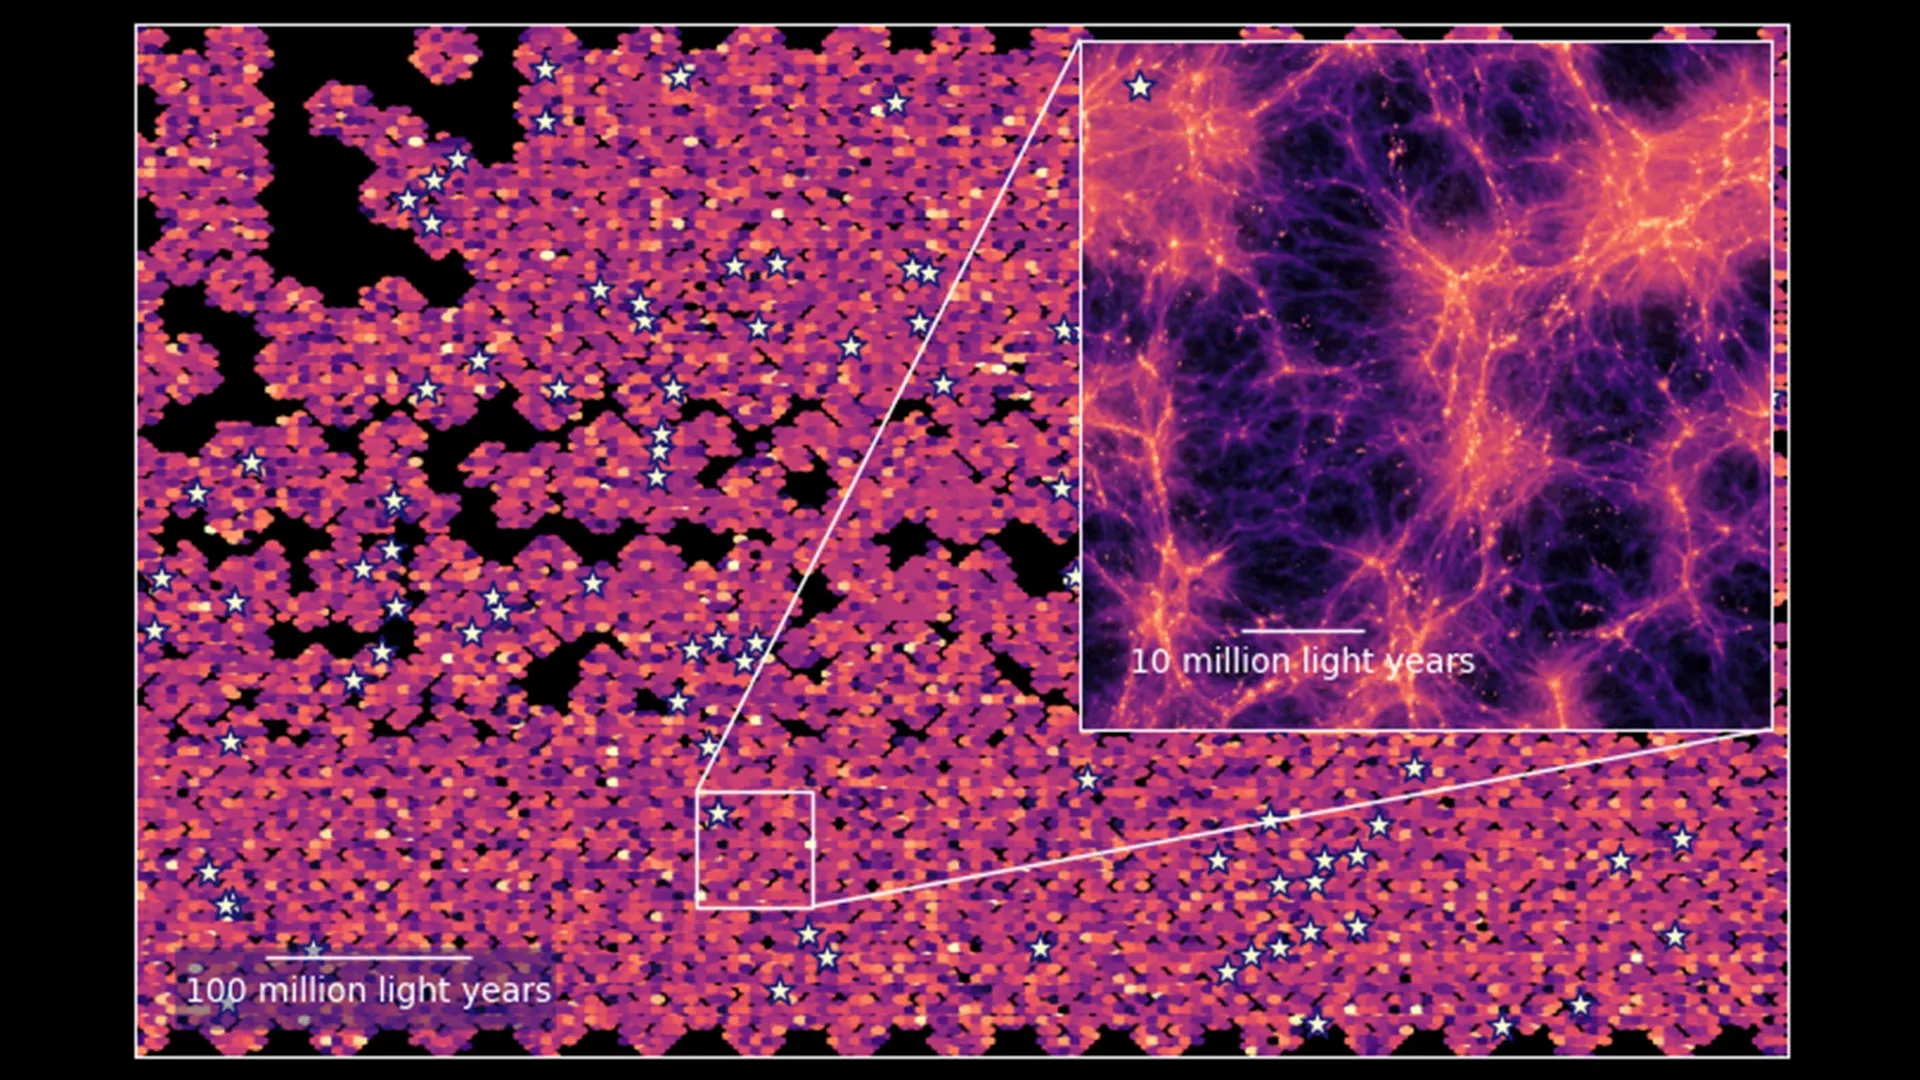
Astronomers working with the Hobby-Eberly Telescope Dark Energy Experiment (HETDEX) have created the most detailed three dimensional map so far of light produced by energized hydrogen in the early universe, dating back roughly 9 billion to 11 billion years. This type of radiation, known as Lyman alpha light, is released in large amounts when hydrogen atoms absorb energy from nearby stars. Because of this property, it serves as a powerful way to locate bright galaxies during this distant period of intense star formation. However, the positions of much dimmer galaxies and clouds of gas that also emit Lyman alpha light have remained mostly hidden.
"Observing the early universe gives us an idea of how galaxies evolved into their current form, and what role intergalactic gas played in this process," said Maja Lujan Niemeyer, a HETDEX scientist and recent graduate from the Max Planck Institute for Astrophysics who led the development of the map. "But because they are far away, many objects in this time are faint and difficult to observe."
To reveal these faint sources, the team used a method known as Line Intensity Mapping. This approach makes it possible to detect the combined glow of many distant objects, helping scientists build a more complete picture of the young universe. The findings were published on March 3 in The Astrophysical Journal.
How Line Intensity Mapping Reveals Hidden Galaxies
Light can be separated into its component wavelengths, producing what scientists call a spectrum. Astronomers study spectra (the plural of "spectrum") by looking for peaks and dips that indicate the presence of particular elements. Instead of identifying individual galaxies one at a time, Line Intensity Mapping measures how strongly a specific element appears across an entire region of space.
"Imagine you're in a plane looking down. The 'traditional' way to do galaxy surveys is like mapping the brightest cities only: you learn where the big population centers are, but you miss everyone that lives in the suburbs and small towns," explained Julian Muñoz, a HETDEX scientist, assistant professor at The University of Texas at Austin, and co-author on the paper. "Intensity mapping is like viewing the same scene through a smudged plane window: you get a blurrier picture, but you capture all the light and not just the brightest spots."
Although Line Intensity Mapping has been used before, this is the first time it has mapped Lyman alpha emission with such a large dataset and such high accuracy. The Hobby-Eberly Telescope at McDonald Observatory gathers enormous amounts of information for HETDEX as it tracks the positions of more than one million bright galaxies in an effort to better understand dark energy. The survey is remarkable not only for its scope but also for its data volume. Researchers have collected more than 600 million spectra from a region of sky spanning an area equivalent to more than 2,000 full Moons.
A Vast Ocean of Untapped Data
"However, we only use a small fraction of all the data we collect, around 5%," explained Karl Gebhardt, HETDEX principal investigator, chair of UT Austin's astronomy department, and co-author on the paper. "There's huge potential in using that remaining data for additional research."
"HETDEX observes everything in a patch of sky, but only a tiny amount of that data is related to the galaxies that are bright enough for the project to use," added Lujan Niemeyer. "But those galaxies are only the tip of the iceberg. There's a whole sea of light in the seemingly empty patches in between."
Supercomputers Reveal the Hidden Structure of the Cosmos
To build the new map, the researchers developed custom software and relied on supercomputers at the Texas Advanced Computing Center. These systems analyzed roughly half a petabyte of HETDEX data. The team then used the known positions of bright galaxies already cataloged by HETDEX to estimate where nearby faint galaxies and glowing gas clouds are located. Because gravity causes matter to cluster together, bright galaxies often mark regions where other objects are likely to be found.
"So, we can use the location of known galaxies as a signpost to identify the distance of the fainter objects," said Eiichiro Komatsu, a HETDEX scientist, scientific director at the Max Planck Institute for Astrophysics, and co-author on the paper. The completed map sharpens the view around bright galaxies while also revealing more detail in the previously unexplored regions between them.
"We have computer simulations of this period," continued Komatsu. "But those are just simulations, not the real universe. Now we have a foundation which can let us know if some of the astrophysics underpinning those simulations is correct."
A New Era of Mapping the Universe
The researchers plan to compare their map with other surveys that examine the same regions of space but focus on different elements. For instance, a Line Intensity Map of carbon monoxide -- which is associated with the dense, cold clouds where stars form -- could help scientists better understand the environments surrounding young stars that produce Lyman alpha radiation.
"This study is a first detection, which is exciting on its own, and it opens the door to a new era of intensity-mapping the universe," said Muñoz. "The Hobby-Eberly is a pioneering telescope. And with new, complementary instruments coming online, we're entering a golden age for mapping the cosmos."
Story Source:
Materials provided by University of Texas at Austin. Note: Content may be edited for style and length.
Journal Reference:
- Maja Lujan Niemeyer, Eiichiro Komatsu, José Luis Bernal, Chris Byrohl, Robin Ciardullo, Olivia Curtis, Daniel J. Farrow, Steven L. Finkelstein, Karl Gebhardt, Caryl Gronwall, Gary J. Hill, Matt J. Jarvis, Donghui Jeong, Erin Mentuch Cooper, Deeshani Mitra, Shiro Mukae, Julian B. Muñoz, Masami Ouchi, Shun Saito, Donald P. Schneider, Lutz Wisotzki. Lyα Intensity Mapping in HETDEX: Galaxy-Lyα Intensity Cross-power Spectrum. The Astrophysical Journal, 2026; 999 (2): 177 DOI: 10.3847/1538-4357/ae3a98
Cite This Page: